
Jan 12, 2026
Master the handicap differential calculation with this guide. Learn the WHS formula, Adjusted Gross Score, and how it creates a fair playing field in golf.

Ever wonder how your Handicap Index actually gets calculated? It all starts with the handicap differential. This is the core formula that levels the playing field in golf, turning your score from any course into a standardized number that reflects how you really played on a given day.
What Is a Handicap Differential, Anyway?
Think of the handicap differential as the engine behind the World Handicap System (WHS). It answers one simple question: How well did you play compared to the difficulty of the course?
It’s the reason a 95 at a beast like Spyglass Hill is seen as a better round than a 90 at your local muni. Without it, comparing scores between different courses would be meaningless.
For anyone running a tournament, getting this concept is non-negotiable. It’s about looking past the raw score and factoring in the real-world challenges of the course and even the weather. This is what allows a scratch golfer and a 20-handicap to compete fairly, no matter where they tee it up.
The Ingredients of the Formula
To really get how the handicap differential works, you need to know what goes into it. Each piece of the puzzle adds critical context to your round, creating a true picture of your performance.
Here’s what you need:
Adjusted Gross Score (AGS): This isn't just the number you write down on the scorecard. The WHS caps your maximum score on any hole at Net Double Bogey. This is a huge deal—it stops one blow-up hole from wrecking your differential and unfairly inflating your handicap.
Course Rating: This tells you what a scratch golfer (someone with a 0.0 Handicap Index) is expected to shoot from a specific set of tees. So, a Course Rating of 72.5 means a top-tier player is expected to finish a little over par.
Slope Rating: This one is key. It measures how much harder the course is for a bogey golfer compared to a scratch golfer. It’s a scale of relative difficulty that ranges from 55 (easier) to 155 (hardest), with 113 being the standard for a course of average difficulty.
Playing Conditions Calculation (PCC): This is an automated, behind-the-scenes adjustment. It accounts for days when the course played significantly harder or easier than normal due to things like high winds, tough pin positions, or soft greens. A PCC of -1.0 means conditions were easier, while a +3.0 means it was a brutal day out there.
A lot of golfers mistakenly believe their Handicap Index is just their average score over par. The reality is, it's calculated from the average of your best 8 score differentials from your most recent 20 rounds. This is designed to reflect your potential ability, not just your average day.
Putting all these pieces together gives you a portable, objective measure of your game. Understanding this is the first step to appreciating the fairness built into modern handicapping—and why having tournament software like Live Tourney to automate these calculations is a game-changer.
Breaking Down the Core Formula
At the heart of modern golf is a single formula that levels the playing field across the globe. It’s the magic that lets a golfer’s round on a tough, windy links course in Scotland be fairly compared to one on a calm parkland track in Florida. The formula might look a little intimidating at first glance, but once you see how the pieces fit together, it's surprisingly straightforward.
This system, known as the World Handicap System (WHS), officially launched on January 1, 2020, bringing over 30 million golfers under one unified standard. The core of it all is the handicap differential calculation.
The formula is: (113 / Slope Rating) x (Adjusted Gross Score - Course Rating - PCC).
Don't worry, we're about to unpack what each of those terms actually means. If you want a deeper dive into how the WHS creates a global standard, the team at Burlingame Country Club wrote a great piece on it.
This flowchart gives a great visual of how your score is just the starting point. The course's difficulty and even the day's playing conditions all feed into the final number.
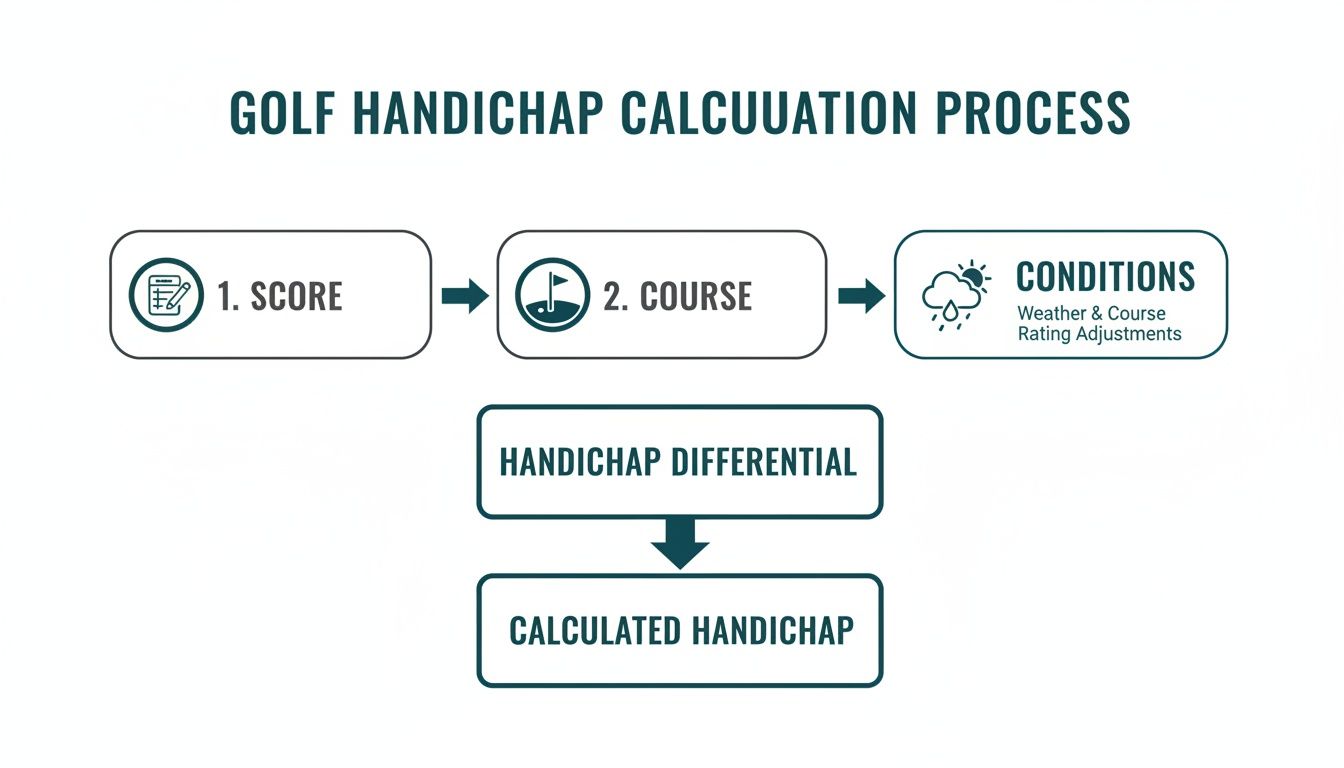
As you can see, it's about much more than just the number you write on the scorecard. The system adds context to your performance to create a true measure of your round.
To make sense of the formula, it helps to break down each variable. This quick-reference table defines every component you'll need.
Key Variables in the Handicap Differential Formula
Variable | Definition | Example Value |
|---|---|---|
113 | A constant representing the Slope Rating of a course of "standard" difficulty. It's the baseline. | 113 |
Slope Rating | Measures how much more difficult a course is for a bogey golfer compared to a scratch golfer. | 135 |
Adjusted Gross Score | Your gross score adjusted for the maximum score allowed on a hole (Net Double Bogey). | 90 |
Course Rating | The expected score for a scratch golfer (0.0 handicap) from a specific set of tees. | 72.1 |
PCC | Playing Conditions Calculation, an adjustment for abnormal course or weather conditions. | -1.0 or +2.0 |
Each of these numbers plays a specific role in turning your raw score into a standardized differential that can be compared to any other round, played anywhere in the world.
The Magic Number: 113
So, what's with the number 113? It’s not random. It represents the Slope Rating of a course with standard difficulty. By putting this constant in the formula, the WHS creates a universal baseline that every score is measured against.
Think of it as a currency exchange rate for golf scores. It doesn't matter if you played a beast of a course with a 145 Slope or an easier track rated at 95. The 113 helps convert your performance into a universal value, allowing an apples-to-apples comparison.
Course Rating vs. Slope Rating
People often confuse these two, but they measure very different things. Getting the distinction right is key to understanding how handicaps work.
Course Rating is what a scratch golfer (a 0.0 Handicap Index) is expected to shoot. If a course has a rating of 72.1, a top player should score just a hair over par. It’s the baseline difficulty.
Slope Rating shows how much harder the course gets for a bogey golfer compared to that scratch player. A high Slope (like 140) means the course gets exponentially tougher for the average player.
For anyone running a tournament, this is absolutely critical. A 15-handicap player might get 16 strokes on a low-slope course but 19 on a high-slope course, even if the Course Ratings are identical. The Slope makes sure players get the right number of strokes for that specific challenge.
Your Score Isn't Always Your Score: Adjusted Gross Score
The final piece of the puzzle is the Adjusted Gross Score (AGS). This is a crucial concept: the score you use for your handicap might not be the same one you wrote on your card. The WHS has a built-in protection against one or two blow-up holes completely wrecking your handicap.
This safeguard is called Net Double Bogey. It sets a maximum score on any hole for handicap purposes. Here’s how it’s calculated:
Your Max Score = Par + 2 (Double Bogey) + Any Handicap Strokes You Get on That Hole
Let's say a player with a 14 Course Handicap is playing a par-4 that's the 10th-hardest hole. They get one handicap stroke there. If they have a nightmare and card a 9, their score for handicap purposes gets adjusted down to a 7. (Par 4 + Double Bogey 2 + 1 Stroke = 7).
This little adjustment is a big deal. It makes sure your handicap reflects your true ability, not just your worst luck on a single hole, keeping the entire system fair and accurate.
Putting the Handicap Differential Formula to the Test
The theory behind the handicap differential is one thing, but seeing it work with real numbers is where it all clicks. Let's walk through a few common scenarios to see how the formula actually translates a score on the course into a standardized number.
We’ll look at a few different golfers playing on courses with varying difficulty. This is where you really see how the system levels the playing field, making a high score on a tough track just as meaningful as a low one on an easier layout.
Low-Handicapper on a Championship Course
First up, imagine a skilled golfer named Alex, who plays to a 4.5 Handicap Index. He’s teeing it up from the tips at a notoriously difficult course for a club event—a real beast known for its length and treacherous greens.
Here's what his round looked like:
Adjusted Gross Score (AGS): 80
Course Rating: 74.8
Slope Rating: 142
Playing Conditions Calculation (PCC): 0.0 (A normal day)
Now, we plug those numbers into the formula: (113 / Slope Rating) x (Adjusted Gross Score - Course Rating - PCC)
So, for Alex, it's: (113 / 142) x (80 - 74.8 - 0.0)
First, the math inside the parentheses:
113 / 142 comes out to 0.7957
80 - 74.8 is 5.2
Multiply those two results together:
0.7957 x 5.2 gives us 4.13764
After rounding to one decimal place, Alex’s score differential for this round is 4.1. Even though he shot an 80, his differential is much lower than his score over par because the course was exceptionally difficult. This is the handicap system doing its job.
Mid-Handicapper on an Average Course
Next, let's look at Brenda, a solid 15.2 Handicap Index. She's playing her usual weekend round at her home course, which is pretty standard in terms of difficulty. Conditions are perfect.
Here’s the data from Brenda's round:
Adjusted Gross Score (AGS): 92
Course Rating: 71.5
Slope Rating: 120
Playing Conditions Calculation (PCC): 0.0
Plugging Brenda's numbers into the same formula: (113 / 120) x (92 - 71.5 - 0.0)
Let's break it down:
113 / 120 is 0.9416
92 - 71.5 equals 20.5
Now, multiply them:
0.9416 x 20.5 = 19.3028
Rounded, Brenda’s score differential is 19.3. Her 92 was a fairly typical performance for her on a standard course, resulting in a differential a bit higher than her Index.
The key takeaway here is that a differential isn't about your score versus par. It’s about measuring your performance against what a scratch golfer would be expected to shoot on that specific course, adjusted for its difficulty.
High-Handicapper with a Weather Adjustment
Our last example is Chris, a 28.8 Index playing in a charity scramble. The course is shorter and more forgiving, but the weather turned nasty—strong winds and rain made scoring much tougher than usual.
Here are Chris's numbers:
Adjusted Gross Score (AGS): 105
Course Rating: 68.9
Slope Rating: 110
Playing Conditions Calculation (PCC): +2.0
That PCC is the game-changer. The system determined that scores were two strokes higher than expected across the board due to the bad weather. This adjustment ensures players aren't penalized for battling the elements.
Let's run the calculation: (113 / 110) x (105 - 68.9 - 2.0)
Breaking down the parts:
113 / 110 equals 1.0272
105 - 68.9 - 2.0 comes to 34.1
And the final multiplication:
1.0272 x 34.1 = 35.02752
Rounded to the nearest tenth, Chris’s score differential is 35.0. Without that +2.0 PCC adjustment, his differential would have been 37.0. It’s a small but critical change that reflects the fairness built into the World Handicap System.
This is also why accurate hole-by-hole scoring is so important. To learn more about getting it right, check out our guide on the best golf scorecard practices.
Turning Score Differentials into a Handicap Index
Figuring out a single score differential is just the first part of the puzzle. The number that really matters in any competition is your Handicap Index, and that comes from looking at your recent history on the course. A single great round—or a truly terrible one—doesn't define your ability. Instead, the World Handicap System (WHS) is designed to measure your demonstrated potential over time.
The system hones in on your most recent 20 scores. From that list, it identifies your 8 lowest score differentials and tosses out the other twelve. This is a key feature, as it ensures a few bad rounds won't unfairly inflate your handicap.
Finding Your Best Eight
Let's imagine a golfer just posted their 20th round. Their record is a mixed bag, which is typical for most of us.
Here’s a look at their last 20 score differentials:
14.2
21.5
12.8 (Best)
17.9
13.5
19.1
14.0
16.6
22.0
15.1
18.4
13.9
20.3
17.2
14.8
19.9
13.1
18.0
14.5
17.7
The WHS automatically flags the eight lowest numbers, which I've bolded above. These eight scores give the clearest picture of that golfer's potential.
Once those eight differentials are pulled out, the next step is simple: average them. You just add them up and divide by eight.
For our example player, the math looks like this: (12.8 + 13.5 + 14.0 + 15.1 + 13.9 + 14.8 + 13.1 + 14.5) / 8 = 14.0875
This result, 14.0875, is the raw Handicap Index. WHS rules state that the final number is truncated to one decimal place, which gives this player an official Handicap Index of 14.0. It’s a clean, consistent method that reflects potential, not just average play. For anyone running a tournament, knowing how this works is critical for verifying handicaps and keeping the competition fair. This is a core part of any event setup, which you can read more about in our guide to golf tournament scoring.
How New Players Get an Index
So what about someone new to the game who doesn’t have 20 scores? The system is built to get them up and running quickly. One of the biggest changes with the 2020 World Handicap System was lowering the barrier to entry. Under the old USGA system, you needed 90 holes (five 18-hole rounds) to get an index. Now, you only need 54 holes, which can be any combination of 9- or 18-hole rounds. It was a huge step in making the game more accessible.
Here’s a quick breakdown of how an index is built as a player adds more scores:
3 Scores: Takes the lowest single score differential and subtracts 2.0 strokes.
4 Scores: Takes the lowest single score differential and subtracts 1.0 stroke.
5 Scores: Averages the 2 lowest differentials.
7-8 Scores: Averages the 2 lowest differentials, then subtracts 1.0 stroke.
9-11 Scores: Averages the 3 lowest differentials.
12-14 Scores: Averages the 4 lowest differentials.
15-16 Scores: Averages the 5 lowest differentials.
17-18 Scores: Averages the 6 lowest differentials.
19 Scores: Averages the 7 lowest differentials.
This tiered approach gives new players a conservative but fair starting point, preventing them from showing up to an event with an unfairly high handicap. As more scores are posted, the calculation gets more precise until they reach the full 20-score history.
Automating Handicap Management for Tournaments
Knowing how to calculate a handicap differential by hand is one thing. Actually doing it for an entire tournament field? That's a completely different beast.
Trying to manually calculate differentials, look up every player's index, and figure out course handicaps for over a hundred golfers is a logistical nightmare just begging for mistakes. This is exactly where modern tournament software comes in, trading hours of tedious spreadsheet work for a few simple clicks.
For golf pros and event organizers, the real goal is to spend less time buried in admin and more time making the event great for the players. Manual data entry is a massive time sink that just adds stress on tournament day. Automated systems get rid of that bottleneck completely.

From Manual Headaches to Automated Ease
Picture this: you're getting ready for a big member-guest event. The old way means collecting every player's GHIN number, looking up their current Handicap Index, and then running the Course Handicap formula for the specific tees they’ll be playing. If a player's index updates the night before—which happens all the time—it could throw everything off, forcing last-minute recalculations and frantic reprints.
Modern platforms like Live Tourney make that whole process obsolete. You can simply upload a player roster with their GHIN numbers, and the software connects directly to the official handicap database. It pulls the most current Handicap Index for every single golfer, instantly.
This seamless integration means you get accuracy down to the decimal point. There’s zero risk of using an old index or messing up a calculation. The system does all the heavy lifting, giving every player their correct Course Handicap for the competition without you having to lift a finger.
The Power of Real-Time Integration
The perks of automation go way beyond the initial setup. Once the tournament tees off, the software handles all the net scoring in real time. As players punch in their scores hole-by-hole, the system automatically applies the right handicap strokes and updates the live leaderboards. It creates a much more dynamic and engaging experience for everyone involved.
Just think about the advantages:
Accuracy: You completely eliminate the chance of math errors when calculating net scores.
Efficiency: Your staff is free to help players instead of being stuck behind a desk entering scores.
Engagement: Live, accurate leaderboards keep players and fans tuned in from the first tee shot to the final putt.
For tournament directors, the biggest win is confidence. You can trust that the results are fair, accurate, and calculated according to official WHS rules without having to double-check every single scorecard by hand.
This shift from manual to automated is what defines a modern, well-run event. For a deeper look into how these systems work, our complete guide to golf tournament scoring software covers the key features that make the biggest difference.
Manual vs. Automated Handicap Management
The contrast between the old way and the new way is stark. This table really highlights how much time and effort you save when you ditch the spreadsheets for a dedicated tournament platform.
Task | Manual Process (Time/Effort) | Automated with Live Tourney |
|---|---|---|
Index Verification | Hours of manual lookup for 100+ players. | Instant import via GHIN integration. |
Course Handicap Calc | Individual calculations for each player, prone to error. | Automatic calculation for all players based on tee selection. |
Net Scorekeeping | Manual entry and calculation after the round. | Real-time, automatic net score updates. |
Leaderboard Updates | Periodic manual updates on a physical scoreboard. | Instant, live leaderboards accessible on any device. |
Ultimately, automating your handicap and scoring process isn't just a convenience—it's a fundamental upgrade to how you run golf events. It delivers a more professional, fair, and fun experience for your staff and your players.
Common Questions About Handicap Calculations
Even when you have the handicap differential formula down, real-world golf throws some curveballs that can leave players and tournament directors scratching their heads. The World Handicap System is pretty comprehensive, but a few specific scenarios seem to cause the most confusion out on the course.
Let's clear up some of the most common questions that pop up when it's time to post scores. Getting these right is all about maintaining fairness and making sure every player trusts the system.
What Happens If a Player Doesn't Finish a Hole?
We’ve all seen it. Someone is having a nightmare on a hole, picks up their ball, and moves on to the next tee to keep the peace. But what score do they actually post for handicap purposes?
When a player starts a hole but doesn't hole out, they need to record their most likely score. This isn't just a wild guess; it's an honest assessment of what they would have shot. The player should count the strokes they've already taken and then add the number of strokes it would most likely take to finish from that spot.
For example, say a player has already hit six shots and their ball is just off the green. A most likely score of eight would be a reasonable number to post. That score is then adjusted down to their Net Double Bogey, if necessary, before it's used for the handicap calculation.
How Are Nine-Hole Scores Handled?
Not every round is a full 18 holes, and the WHS is built to handle that. When a player posts a nine-hole score, it doesn't get turned into a differential right away. Instead, the system holds onto it.
It just waits until the player posts another nine-hole score. Once it has two, it combines them to create a full 18-hole Score Differential, which then gets added to the player's scoring record. This is a great feature that ensures shorter, more frequent rounds still count towards an accurate Handicap Index.
A quick note for tournament organizers: A player can get their very first Handicap Index with just 54 holes of play. This can be any combination of nine- and 18-hole rounds, making it much easier for new or casual players to get handicapped and join in on your events.
Why Did My Handicap Index Change If I Didn't Even Play?
This is easily one of the most common points of confusion. A player wakes up, checks their handicap, and sees that it’s changed overnight even though they haven't been near a course. How does that happen?
It’s because a Handicap Index is a rolling average of the best 8 of the most recent 20 scores. Every time you post a new score, the oldest of those 20 scores gets kicked out.
If the score that dropped off was from a really bad round (a high differential) and the new one is pretty good, your Index will likely go down. But the opposite is also true. If a great score drops off your record, your Index might go up, even if your most recent round was just average. The system is always fluid, reflecting your most current potential.
While we're talking about golf, the general concept of handicapping pops up in other competitive arenas, too. For a different take, you can see how handicap betting explained in football applies similar principles.
Managing these little details is what makes a tournament feel professional and fair. With Live Tourney, you can stop worrying about the nuances and let the software handle every calculation instantly and by the book. Elevate your next event by visiting https://livetourney.com to start your free trial.


